Generating Postscript graphs using PyX
Postscript is an interpreted language which is highly oriented toward graphics and typography. It is a device-independent, stack-based page description language used in the desktop publishing area.
As Don Lancaster of TV
typewriter fame comments, "Postscript is an underappreciated
yet superb general purpose computing language. In its spare time, PostScript
also excels at dirtying up otherwise clean sheets of paper."
PyX is a Python package which can be used to generate publication-ready,
high-quality PostScript files. It combines an abstraction of the PostScript
drawing model with a TeX/LaTeX interface.
A prelude to PostScript
PostScript is an object-oriented, interpreted, dynamically-typed,
stack-based language which follows the
Reverse Polish
Notation syntax. PostScript treats images and fonts as a
collection of geometrical objects rather than as bitmaps. As it is an
interpreted language, it needs an interpreter that executes PostScript
instructions. Ghostscript is the most famous PostScript interpreter
which runs on Linux, Windows, and Mac Operating Systems. Since PostScript
is dynamically typed, its variables do not have a declared
type and can contain any kind of value.
As any other programming language, it works with various types of data such
as numbers, characters, strings and arrays. These are referred to as
PostScript 'objects'. It manipulates data using variables
and also using a special entity called a 'stack'. The stack is a piece of
memory set aside for data to be used by PostScript. Like any ordinary stack, it
is a 'last in, first out' type data structure. The operator and operand
handling of a PostScript interpreter can be demonstrated using this small
example:
1 2 addThe operands 1 and 2 are pushed on to the stack and then the add operator replaces them with their sum. That is, the 'add' operator removes the top two numbers from the stack, adds them, and pushes the sum back onto the stack. The same is true for the 'sub', 'div', 'mod', and 'mul' operators.
Let's get our hands dirty with some PostScript snippets
If I say that PostScript is the world's best programming language to "Just let it out what is in your heart", it won't be an exaggerated statement. Imagine the situation where you have a crush on the human being sitting next to you. You can't use any other language as those languages can either provide only console based black and white things (totally unromantic) - or if you managed to get a romantic output, the code will take several pages. But just think of PostScript - and in 6 lines, you can express your feelings to the person you care for. See the code in heart.ps for example. The recipient will have to invoke a PostScript interpreter to see the what's in your geek heart, though.
gv heart.ps

%!ps                                % Every PostScript program should start with this line.
1 0 0 setrgbcolor                   %sets the color as red (rgb)
250 210 moveto                      %sets the initial position
270 170 100 100 200 275 curveto     %draws the two curves
400 170 100 100 200 275 curveto
fill
showpage
A "Hello, world!" program in PostScript is available here [see helloworld.ps]. It's simple: just issue the string to be displayed, in parentheses, after setting the font and position of the text:
/Helvetica findfont    % Get the basic font
30 scalefont           % Scale the font to 30 points
setfont                % Make Helvitica the current font
250 450 moveto         % Text positioned at (250,450)
(Hello World !)
show
showpage
This will show "Hello World !" in the specified position. Another string manipulating program which contains a 'for' loop is given here [LG.ps]. Another simple program to understand the graphical nature of PostScript is the drawing of a square using lineto [square.ps].
A Simple PostScript program using PyX
Generally the PostScript programs are generated by other applications.
So from now on, instead of writing by hand, we are giving the
resposibility of generating PostScript programs to a great graphical package
available in Python programming language - PyX.
PyX is available for download at the SourceForge
Download Page. It can be installed just like any other Python module.
tar zxvf PyX-0.10.tar.gz
cd PyX-0.10
python setup.py install
A complete installation of Tex should be present in your system as PyX depends on it. As Tex is usually distributed with almost all the standard distributions as part of authoring and publishing, it can be easily installed using the "Add/Remove Software" option in your distribution. If it is not present, another way to install TeX support in your system is:
yum install tetex           # on Redhat/Fedora distributions
apt-get install tetex-latex # on Debian/Ubuntu distributions
Now let's try a small Python program to dive into the PostScript world using PyX [see listing5].
from pyx import *

c = canvas.canvas()
c.text(10, 10, "Hello, world!")
c.writePSfile("hello")
Run this program as python hello.py
This will create a file "hello.ps" in the present working directory. To see the output, you can use Ghostview (gv), Gimp, or 'evince' as these programs can also display the PostScript output.
Some more PostScript graphs
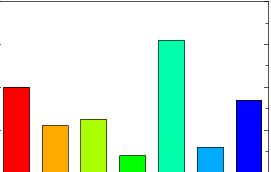
A graph is generally used to depict the relationship between two or more variables with a discrete or continuous value range. It is very useful in visualizing collected data. One of such data sets that I collect daily is the blood sugar count of my mother who is a diabetes patient. This helps us to regulate her insulin injection volume as well as managing her diet. Last week's data is [diabetes.dat]:
Sunday    260
Monday    242
Tuesday   245
Wednesday 228
Thursday  282
Friday    232
Saturday  254

The Python program to visualize
this data is [diabetes.py]:
from pyx import *

g = graph.graphxy(width=8, x=graph.axis.bar())  # creates a graphxy instance
g.plot(graph.data.file("diabetes.dat", xname=0, y=2), [graph.style.changebar()]) # reads data from diabetes.dat
g.writePSfile("diabetes") # generates the PostScript file
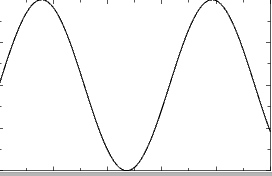
The output of this program is [diabetes.ps]. PyX can generate graphs based on the functions also.

from pyx import *

g = graph.graphxy(width=8)
g.plot(graph.data.function("y(x)=sin(x)", min=0, max=10))
g.writePSfile("sine")
The output of this program is [sine.ps]. The PyX
package supports the generation of 3D graphs with the help of the
'graphxyz'
instance. Exploring the features of PyX will be a truly rewarding experience
if you want to 'visualize' the particular data that you are interested in.
Conclusion
Apart from being the worldwide leader in printing and imaging standard,
PostScript is the champion of platform-independent documentation
standards as well as excellent output quality.
PyX provides a very sophisticated PostScript graph generation mechanism using
the Python language. It provides full access to the PostScript features and helps
the programmer to generate high quality graphs without much effort.
References
The PostScript Language Reference, the Blue Book, and the Green Book are the "classic" books to go for, if you have a crush on PostScript.Tinaja.com provides information regarding some interesting capabilities of PostScript.
The best documentation for the PyX package is available at the PyX SourceForge page.
Talkback: Discuss this article with The Answer Gang
I am an ardent fan of GNU/Linux from India. I admire the power,
stability and flexibility offered by Linux. I must thank my guru, Mr.
Pramode C. E., for introducing me to the fascinating world of Linux.
I have completed my Masters in Computer Applications from Govt.
Engineering College, Thrissur (Kerala, India) and am presently working at
Ushus Technologies, Thiruvananthapuram, India, as a Software Engineer.
In my spare time, you can find me fiddling with Free Software, free
diving into the depths of Ashtamudi Lake, and practicing Yoga. My other
areas of interest include Python, device drivers, and embedded
systems.


